On this page
In brief: Payback follows verified capacity and cash-flow assumptions, not catalogue cycle time or a headline about labour replacement. A business case is only as sound as the baseline it starts from.
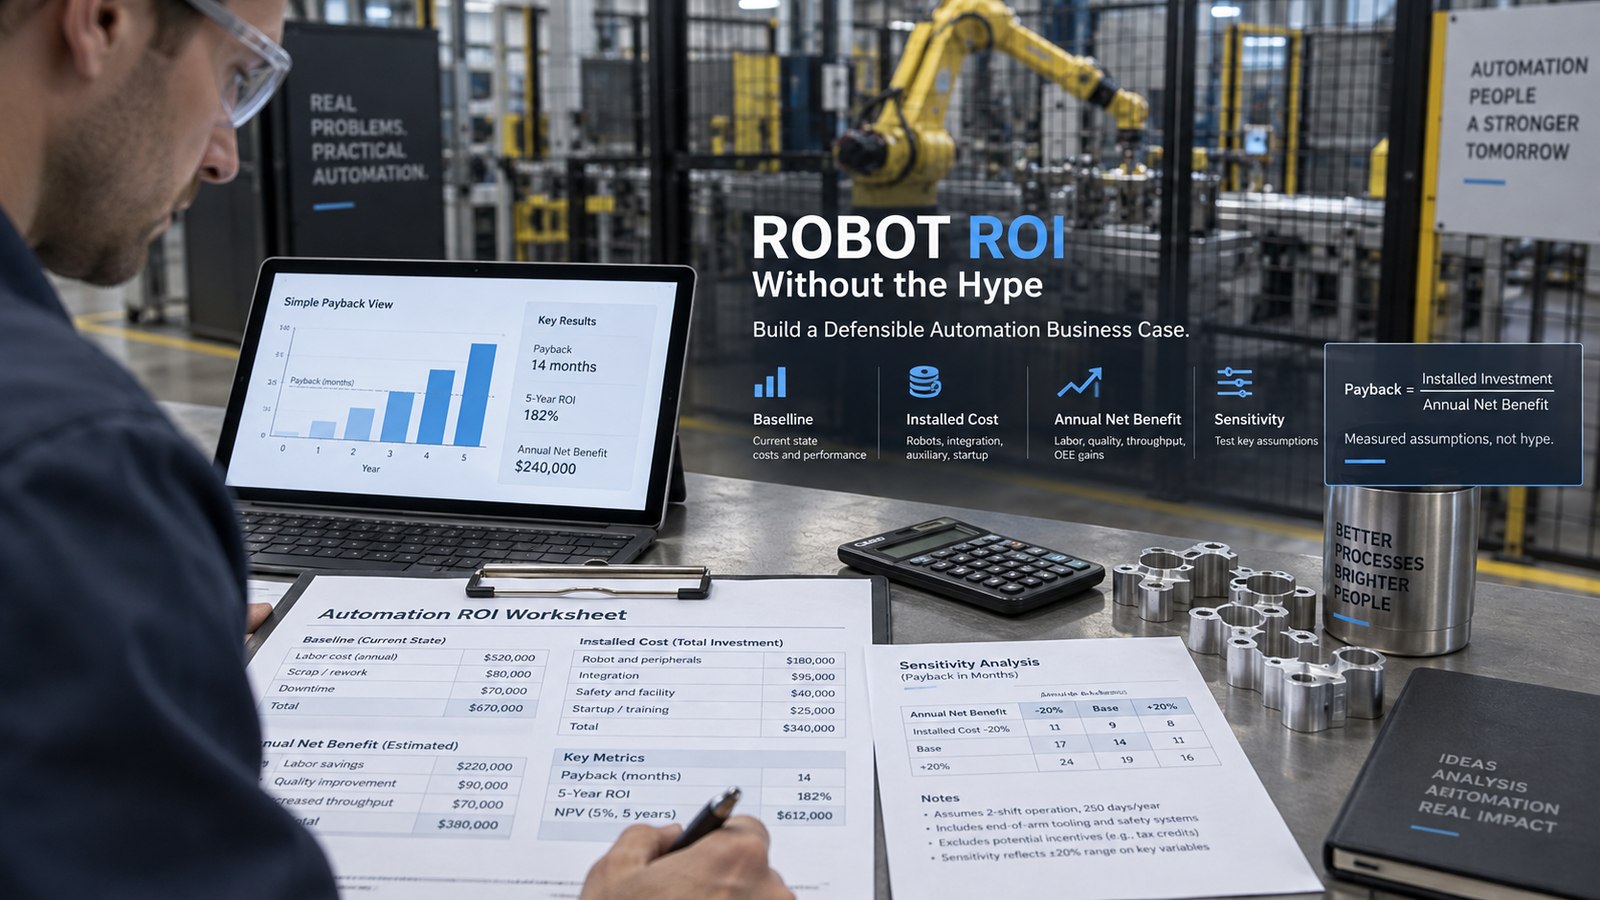
A robot business case usually goes wrong in one of two places. Either the benefit is counted on output that the plant cannot sell or the cell cannot reach, or the investment is counted without the things that make the robot work. The arithmetic is the easy part. This guide sets out which inputs need evidence, shows the calculation with deliberately round numbers, and explains why a single payback figure is not enough to decide.
Describe the baseline honestly
Start from what the process does today: good parts per hour, the hours it really runs, scrap and rework, planned stops, and what the operators do besides loading parts. Then ask what limits output. If the machine upstream is the bottleneck, or demand is already met, a faster cell brings no additional revenue and its benefit is confined to cost. Separate costs that disappear from work that is redeployed: an operator who moves to another station is still on the payroll, so the saving is real only if that other work has a value you can state. Market figures do not help here. On 8 January 2026 the IFR reported that the global market value of industrial robot installations had reached an all-time high of US$ 16.7 billion. That describes the market, not the return of one cell.
Count the complete investment
The installed investment is the robot and controller plus process equipment, tooling, conveyors, safeguarding, PLC work, systems engineering, commissioning, transport, training and a contingency. Recurring costs run against the benefit every year: maintenance, replacement tooling, software support, energy and changeovers. Use the same time horizon and the same cost categories for every alternative you compare, including the alternative of leaving the process as it is.
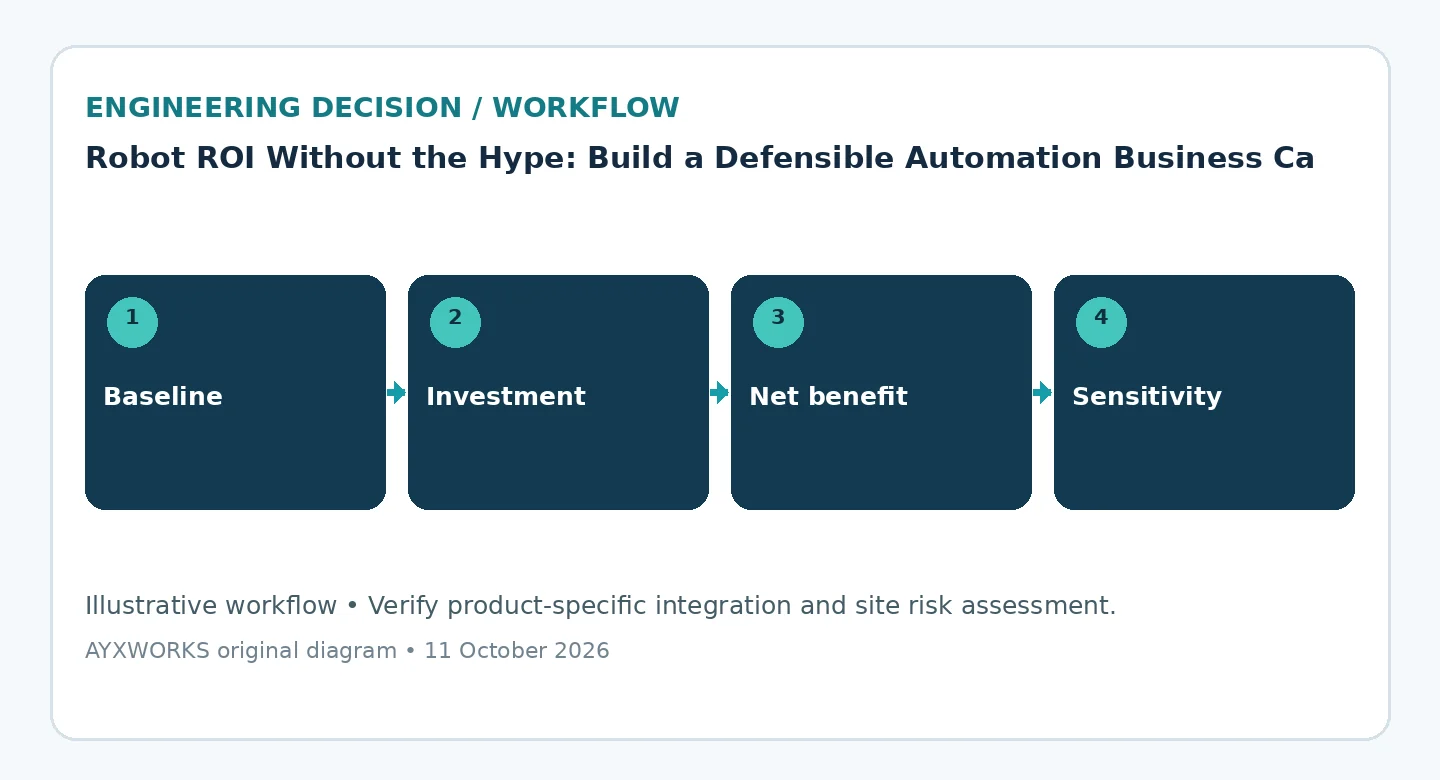
Show the arithmetic and label it
Illustrative example only: the numbers below are invented to show the calculation and come from no real project. A total installed investment of €120,000 and an annual net benefit of €35,000 after recurring costs give a simple payback of 120,000 ÷ 35,000 = 3.43 years. If the realised benefit is €20,000 a year, payback becomes 6 years. Neither scenario predicts the result of any real factory.
Simple payback is also a limited measure. NIST’s guide to investment analysis for manufacturers describes it as the time required to recoup the investment without discounting any cash flows, notes that it does not consider cash flows beyond the payback period, and says that for large investments it should be treated as a supplement to net present value.
Stress-test the operating model
A single figure hides how strongly the result depends on a few assumptions. Recalculate it with cell availability at, for example, 70%, 85% and 95%, with slower changeovers, with higher tooling costs, with demand below plan, and with the machine that feeds the cell still acting as the bottleneck. Do not assume the full benefit from month 1: ramp-up, operator training and debugging delay it. If the investment is justified only when every input takes its most favourable value, that is the finding to report. A positive financial model is also not a safety or technical acceptance test; it says nothing about whether the cell can be built and accepted.
Checklist before committing budget or scope
- Baseline output of good parts, running hours and saleable demand, taken from measured data.
- The constraint that limits output today, and whether the cell removes it.
- Installed investment including engineering, safeguarding, training and contingency.
- Annual net benefit after recurring costs, with redeployed labour valued separately.
- Sensitivity scenarios for availability, demand and ramp-up.
- Assumptions written down and compared with the FAT, SAT and ramp-up results.
What this guide does not establish
This guide is a planning aid. It is not financial, tax or accounting advice, it contains no data from a real installation, and its worked example is illustrative. Depreciation, financing, subsidies and tax treatment differ by company and country and are not covered. A business case does not replace technical feasibility work, the risk assessment or acceptance testing, which have to be carried out on the real system by suitably qualified people.
Sources and further verification
- NIST — Douglas S. Thomas, Investment Analysis Methods: A practitioner’s guide to understanding the basic principles for investment decisions in manufacturing, NIST Advanced Manufacturing Series 200-5 (2017-10; accessed 2026-10-12).
- IFR — Top 5 Global Robotics Trends 2026, press release (2026-01-08; accessed 2026-10-12).
Next useful step
If you are building the business case for a specific cell, bring the measured baseline (good parts per hour, running hours, scrap), the demand you can sell, the part and process, and the cost items you already know to the Robotics & Automation page and solution finder. Projects taken on from there are scoped and delivered through Eurobots/ReBots, and they start with feasibility and responsibility boundaries, not with an assumed turnkey installation. The engineering background to these guides is in the AYXWORKS portfolio.
Image credit: ayxworks — Original / rights held.