On this page
In brief: Use rule-based vision when a stable, measurable feature separates good parts from bad ones. Consider learned (AI) vision when real variation defeats a well-engineered rule and you have representative labelled images. Decide by how each approach fails, not by which one is newer.
Start with the image, not the algorithm
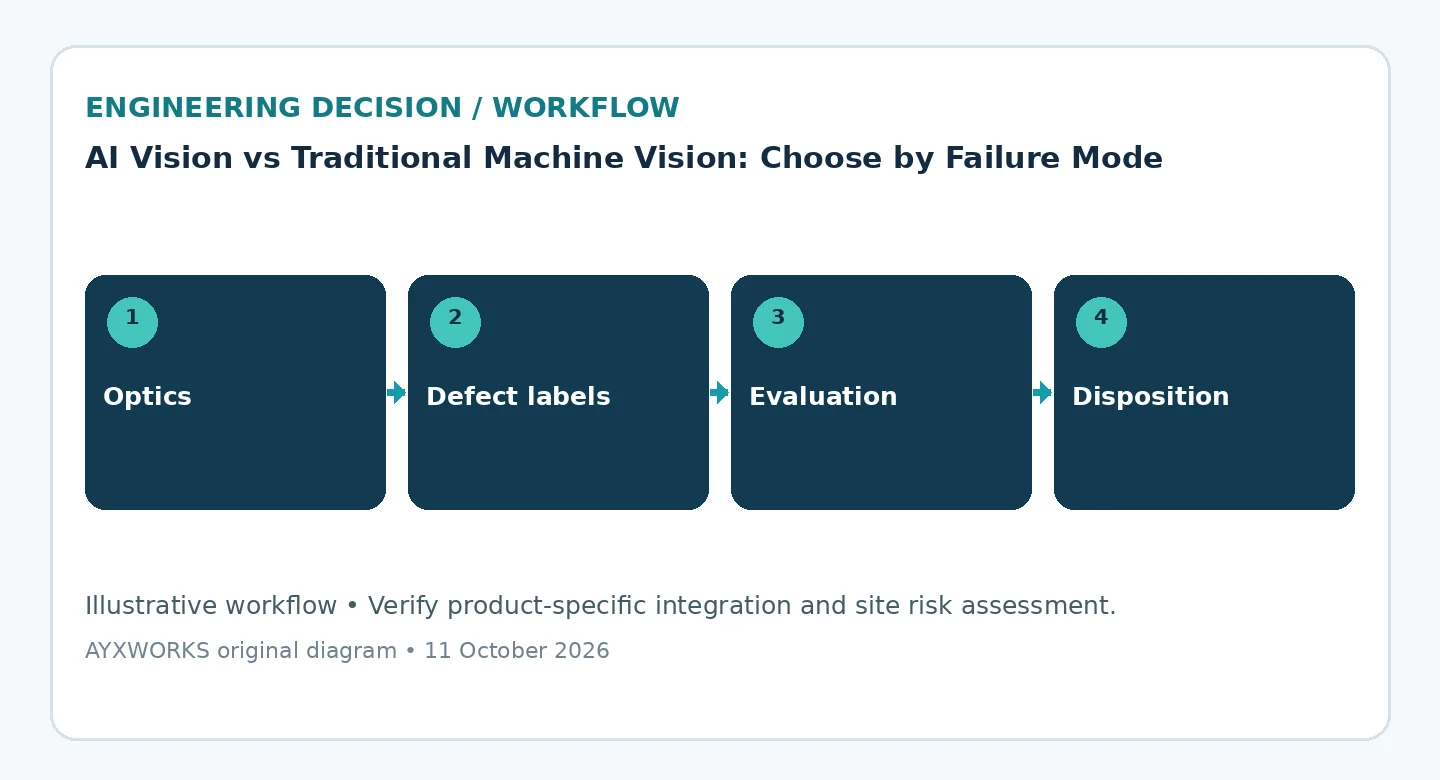
Lighting angle, exposure, lens distortion, depth of field, motion blur and fixture repeatability determine what the pixels can show. No algorithm, classical or neural, recovers detail that the sensor never captured. So fix the optical set-up first, and have quality engineers agree on what counts as a defect, with boundary samples, before any software is compared. If two inspectors disagree about a part, a model trained on their labels inherits the disagreement.
Where rules are strong, and how they fail
A rule-based tool measures something explicit: the position of an edge, the area of a region, a distance under calibrated geometry, a code that reads or does not. Presence checks, gauging, alignment on high-contrast features and code reading are therefore deterministic and explainable. When a part is rejected, the measured value and the limit tell you why. Rules fail when the feature stops being stable: a different surface finish, a reflection or a new supplier’s texture shifts the threshold, and somebody has to retune it by hand.
Where learned models help, and what they cost
A trained classification or segmentation model learns what good and bad look like from examples. That helps with textured or cosmetic defects and with variable backgrounds, which are hard to write down as a rule. The cost is a different kind of work: collecting and labelling images, managing model versions and watching for drift when production changes. A learned model also fails differently. It can return a confident answer for an image unlike anything in its training data, and the reason behind a single decision is harder to read.
Measure the two error types separately
A false accept ships a defect; a false reject scraps or reworks a good part. Their costs differ, so report them separately and per defect class, not as a single accuracy figure. Hold back complete part families, batches or production periods as test data, so that the model is not scored on images almost identical to the ones it learned from. The NIST AI Risk Management Framework makes the same general point for any AI system: performance should be demonstrated for conditions similar to the deployment setting, and systems should be tested before deployment and regularly while in operation. Measure inference time under line load as well, because the worst case determines the cycle time.
Plan the fallback and the change process
Decide who owns the threshold, who approves a new model version and how long images are kept. Define what the station does when the camera disconnects, the optics get dirty or confidence is low; routing the part to manual inspection is the usual answer. The two approaches can also be combined, with rules for presence and dimensions and a learned model for surface appearance. A classifier output is not a validated safety function and must not be used as one.
Checklist before committing budget or scope
- Representative images of good parts and of each defect class, with boundary samples agreed by quality.
- Evidence that lighting and fixturing stay stable across shifts and batches.
- False-accept and false-reject rates per defect class, measured on held-out data.
- Worst-case inference time measured under line conditions.
- A defined fallback for low confidence, a dirty lens or a lost camera.
- A named owner for thresholds, model versions and drift monitoring.
What this guide does not establish
This guide is a planning aid. It does not report tests, compare products or predict the detection rate of any system on your parts; that can only be measured on your line with your images. Inspection that feeds a safety or regulatory decision needs its own validation by suitably qualified parties.
Sources and further verification
- NIST — AI Risk Management Framework (AI RMF 1.0), Core: Govern, Map, Measure, Manage (2023 framework; NIST states that a revision is in progress; accessed 2026-10-12).
- Association for Advancing Automation (A3) — What Every Machine Vision User Should Know About Lighting (listed date 2002-02-12; background reading on lighting; accessed 2026-10-11).
Next useful step
Bring sample images of good and defective parts, your defect definitions, the line speed and any inspection results you already have to the Robotics & Automation page. The AYXWORKS portfolio shows the engineering approach behind these guides. Any project that follows is scoped and delivered through Eurobots/ReBots, and it starts with feasibility and responsibility boundaries, not with an assumed turnkey installation.
Image credit: Max Gruber — Wikimedia Commons (CC BY 4.0; cropped to 16:9).