On this page
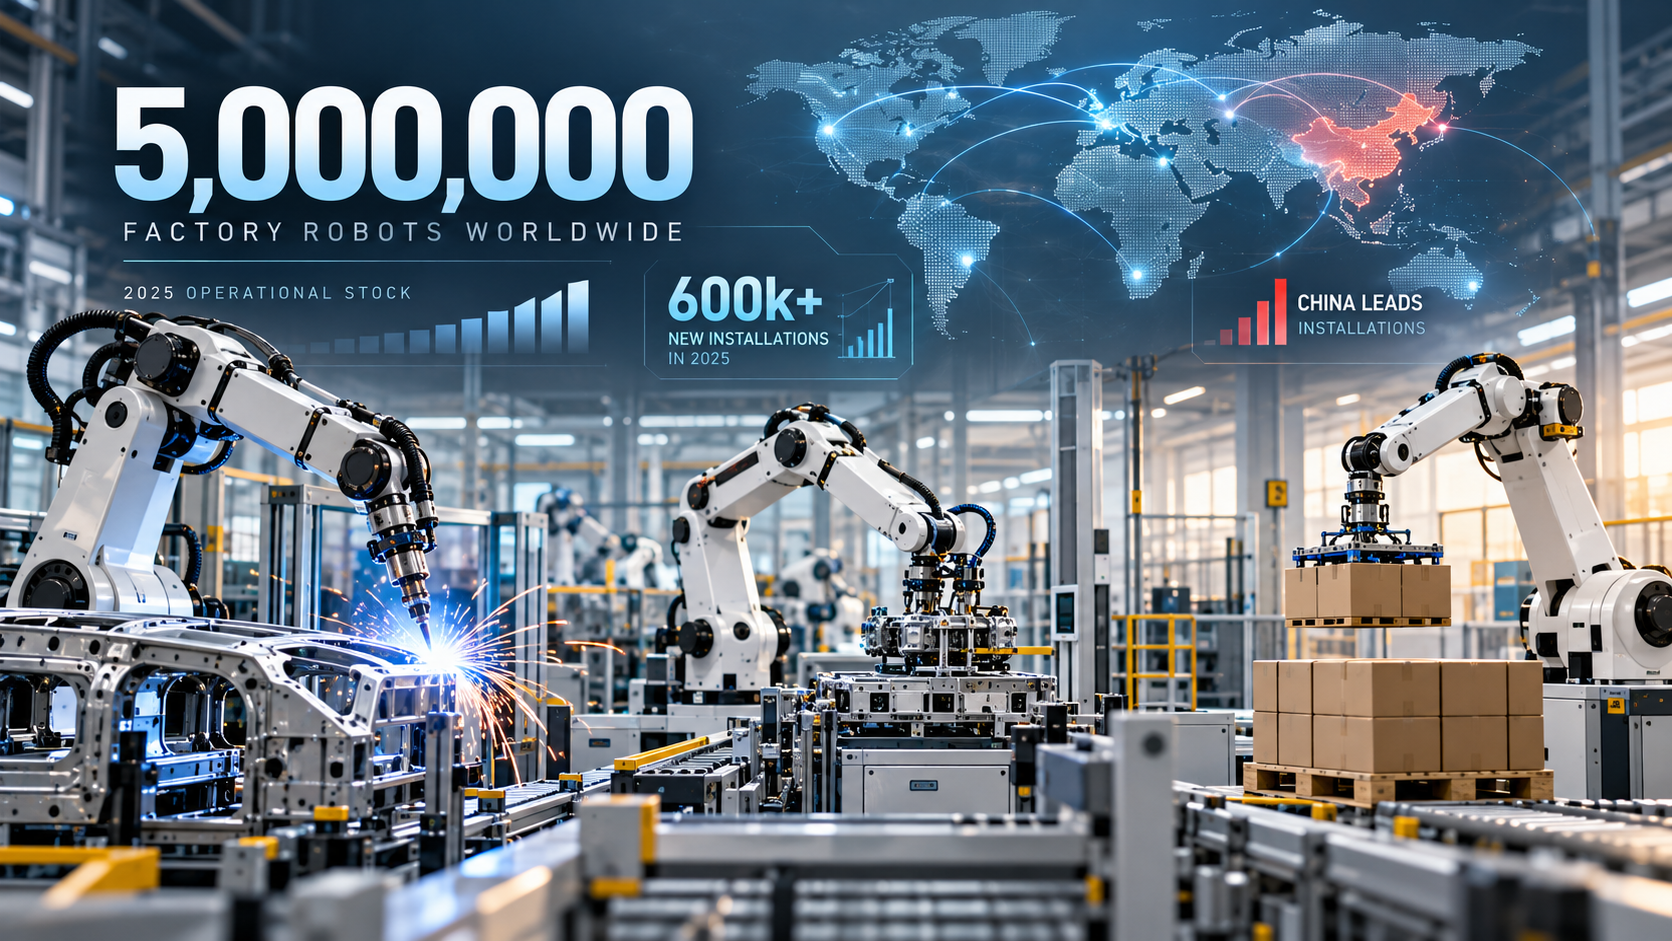
Five million industrial robots are now working in factories around the world. Think about that for a moment: millions of machines welding car bodies, loading CNC machines, moving components, assembling electronics and handling production tasks that once depended entirely on human operators.
It is an impressive milestone. But the most interesting part of the International Federation of Robotics’ (IFR) latest figures is not simply how many robots exist. It is where manufacturers are investing, which industries are growing, and how different the global robotics market looks from one country to another.
According to the IFR’s World Robotics 2026 announcement, factories installed a record 603,000 industrial robots in 2025, bringing the worldwide operational stock to approximately 5.08 million units.
China accounts for an extraordinary share of that activity. The United States has overtaken Japan in annual installations. Europe is advancing more slowly, and Spain recorded a decline.
For manufacturers considering automation, these developments offer valuable context. They also raise a more practical question: does an expanding global robot market mean your factory should invest in another robot?
Not necessarily. Understanding why is where the statistics become genuinely useful.
Research note: Updated 13 October 2026. This article examines figures for 2025 published by IFR on 24 September 2026, alongside IFR’s public World Robotics 2026 conference presentation. Historical results are distinguished from forecasts. This is research-based analysis, not an independent audit of IFR’s dataset.
World Robotics 2026: the numbers that matter
Before examining countries and industries, we need to separate two statistics that are frequently confused: operational stock and annual installations.
They measure different things.
- 5.079 million industrial robots in operation: the estimated worldwide operational stock at the end of 2025, up approximately 9% from 2024.
- 603,000 industrial robots installed in 2025: the number added through annual installations, up 11% from the previous year.
- 66,240 collaborative robots installed: roughly 11% of all industrial robot installations in 2025, according to IFR’s public conference presentation.
The first number describes the installed base accumulated across years. The second tells us about deployment activity during a particular year. The third helps explain the role of collaborative robotics within the wider market.
Why the difference between stock and installations matters
Imagine a factory with 20 working industrial robots. It buys two additional robots, retires one obsolete unit and finishes the year operating 21.
In this simplified hypothetical example, its annual installations and its operational stock are not the same number. One describes additions during the year; the other describes what remains operational at year-end.
The same distinction applies globally, although the real statistics are more complex because they involve reporting methods, installed equipment, retirements and revisions.
IFR’s publicly presented figures show that worldwide operational stock rose from approximately 4.664 million robots in 2024 to 5.079 million in 2025. That does not mean we can subtract the increase from annual installations and obtain an independently verified number of robots scrapped or retired.
More importantly, neither figure tells us how effectively those robots are being used. A robot running three shifts in a carefully engineered automotive cell and another operating intermittently in a small workshop both contribute to the stock.
Robot count is a measure of adoption, not a direct measure of productivity.
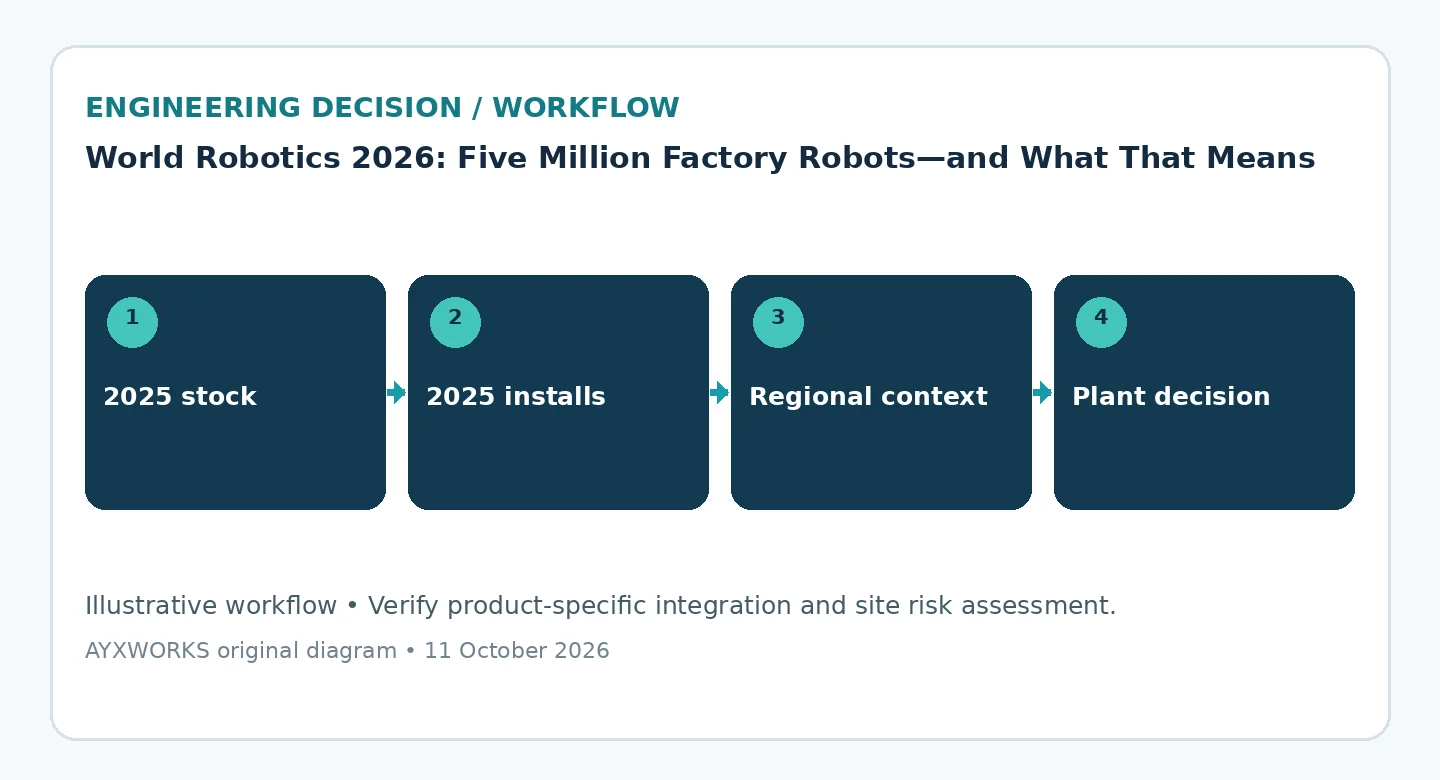
China dominates industrial robot installations
If there is one statistic from World Robotics 2026 that deserves attention, it is China’s position in the market.
Chinese factories installed approximately 354,000 industrial robots in 2025, an increase of 20% over the previous year.
That represents 59% of global annual installations. In other words, nearly six out of every ten industrial robots installed worldwide during 2025 were deployed in China.
This matters for more than the size of the Chinese manufacturing industry. It shows how strongly industrial automation investment is concentrated geographically.
Chinese robot manufacturers are also growing
IFR reports that Chinese robot manufacturers supplied approximately 195,000 units installed in their domestic market during 2025, an increase of 15%.
That gave domestic manufacturers a 55% share of installations in China, compared with 57% in 2024.
There is an interesting detail here: the absolute number supplied by Chinese manufacturers grew, even though their percentage share slipped slightly.
Both can happen when a market expands rapidly. Market share alone does not tell the full story.
For international robot buyers, this expansion makes Chinese industrial robot suppliers an important part of the competitive landscape. However, a manufacturer’s sales performance is not sufficient evidence of machine quality, controller compatibility, spare-parts availability, safety functionality or long-term service support.
Those factors still need to be evaluated for the particular model, application and region.
The United States overtakes Japan, while Europe slows
Global robotics demand is not moving in one direction at the same speed.
While installations rose sharply in China, the situation was more mixed in the United States, Japan and Europe.
| Country | 2025 installations | Annual change |
|---|---|---|
| China | 354,000 | +20% |
| United States | Almost 38,500 | +12% |
| Japan | 36,219 | -19% |
| Germany | Fewer than 25,000 | -8% |
| Italy | About 7,800 | -11% |
| France | Almost 4,500 | -8% |
| Spain | About 4,300 | -15% |
Source: IFR World Robotics 2026 press release, published 24 September 2026. Rounded figures are retained where IFR reports approximate values. Changes compare annual installations with 2024.
The United States moved ahead of Japan to become the world’s second-largest national market for annual industrial robot installations. US installations rose by 12%, while Japan experienced a 19% decline.
Germany remains the largest European market, representing 41% of European Union industrial robot installations in 2025. Yet German demand fell during the year, as did installations in Italy, France and Spain.
What does this mean for Spanish manufacturers?
Spain’s approximately 4,300 installations and 15% annual decline are worth watching, particularly for engineering companies, integrators and industrial equipment suppliers.
But there is an important distinction between market demand and project feasibility.
Fewer robots installed nationally does not automatically mean that automation has become less attractive for an individual Spanish manufacturer.
A factory struggling with repetitive manual handling, inconsistent welding quality or unused machine capacity may still have a strong automation opportunity, regardless of national installation growth.
Conversely, strong market growth does not make an unsuitable application economically viable.
The regional figures also cannot tell us directly whether a local integrator has spare capacity, whether a particular robot model is available immediately, or how quickly replacement components can be obtained.
Those questions require supplier-specific evidence, not global statistics.
Industrial robotics is expanding beyond the automotive factory
Industrial robots are often associated with car manufacturing. That association is understandable: automotive production has historically been one of the most visible examples of large-scale robotic automation.
But the World Robotics 2026 presentation highlights demand across several manufacturing sectors.
In 2025, IFR’s public data show:
- Electrical and electronics: approximately 142,000 installations, up 10%.
- Automotive: approximately 138,000 installations, up 10%.
- Metal and machinery: approximately 109,000 installations, up 22%.
The metal and machinery figure is particularly interesting for general industrial engineering. It reflects a significant increase in robot installations beyond the traditional automotive production environment.
These sectors include very different process requirements. Handling a machined component, positioning a welding torch and assembling an electronic product are not interchangeable tasks.
Each application has its own constraints involving positioning accuracy, tooling, part presentation, cycle time, inspection and system integration.
That is why the growth of industrial robotics should not be interpreted as evidence that every production activity can be automated using the same robot architecture.
What about cobots? Collaborative robots are growing, but they are not the whole market
Collaborative robots, commonly called cobots, receive considerable attention because they are often easier to approach from a programming and deployment perspective.
However, IFR’s figures help put that attention into context.
According to the World Robotics 2026 public presentation, approximately 66,240 collaborative industrial robots were installed in 2025, an increase of 7% year over year.
That represents approximately 11% of all industrial robot installations.
The remaining 89% were other industrial robot types.
This does not make cobots insignificant. It simply shows that conventional industrial robots remain the majority of annual installations.
For buyers, the relevant question is not whether cobots are more modern than conventional industrial robots. It is which architecture best fits the application.
A cobot can make sense when hand-guided teaching, changing production requirements or operator interaction are important. A conventional industrial robot may be more suitable when a demanding production cycle, payload, reach or process requires a different solution.
And an essential safety point is often overlooked: buying a collaborative robot does not automatically make the complete application safe for unguarded human interaction.
The robot, its tooling, workpiece, operating modes, potential contact forces and surrounding machinery all contribute to the risk assessment.
A sharp gripper, a hot welding torch or a heavy workpiece does not become harmless because it is attached to a collaborative arm.
The overlooked question: are factories getting value from their robots?
The headline numbers describe how widely industrial robots have been adopted. They do not measure how well every installation performs.
For manufacturers, that distinction is fundamental.
A robotic cell that looks excellent during a demonstration can struggle in real production because of inconsistent incoming parts, difficult fixtures, unexpected stoppages, poor operator training or unreliable communication with surrounding equipment.
Consider a straightforward example.
A hypothetical CNC machine-tending application
Imagine a CNC machine with a 90-second machining cycle. An operator takes 12 seconds to remove the finished component and load the next one.
Assume those activities happen sequentially, without overlap.
The current theoretical production cycle is 102 seconds per part.
Now imagine a robot performing the same loading and unloading operation in eight seconds. The theoretical cycle falls to 98 seconds.
The loading operation is one-third faster, but the total production cycle improves by only around 4%.
That difference is easy to overlook when a proposal focuses only on robot motion.
And even this simplified calculation leaves out equipment availability, rejects, part supply, gripper failures, operator intervention and recovery after a machine alarm.
The project might still be valuable if it enables longer unattended operation, reallocates operator time or reduces handling variability. But those benefits must be calculated separately and supported by realistic production assumptions.
A faster robot movement is not necessarily a faster factory.
How to turn the robotics statistics into an investment decision
The best use of World Robotics 2026 is to understand the market and then bring the decision back to the process you actually need to improve.
A practical initial feasibility assessment can follow six steps.
- Choose a clearly defined application. Select a recurring task such as CNC loading, palletizing, welding, pick-and-place or material handling. Avoid beginning with a robot brand or catalogue.
- Measure the current process. Record actual cycle times, production volume, machine availability, scrap, rework, changeover frequency and operator involvement.
- Check technical feasibility. Evaluate payload including tooling, working envelope, reach, part variation, accuracy, fixtures, interfaces and environmental constraints.
- Define the complete cell. Include the end effector, sensors, PLC or machine interface, guarding, functional safety, material presentation and fault-recovery behavior. Establish who is responsible for each integration and commissioning activity.
- Build a financial model. Include all one-time costs and realistic recurring expenses, then quantify operational benefits without double counting labor, quality or capacity improvements.
- Verify performance before acceptance. Agree on measurable criteria and test them with representative components, operating conditions, failures and recovery scenarios.
The purpose is not to make every project more complicated. It is to avoid discovering the expensive problems after the robot has already been purchased.
New or refurbished robots: why purchase price is only part of the calculation
The expanding worldwide installed base also makes robot lifecycle decisions relevant: maintaining existing equipment, repairing failed units, upgrading controllers and considering refurbished industrial robots.
But the IFR installation statistics do not tell us whether a new or refurbished robot is the better purchase for any particular application.
A refurbished industrial robot can be economically attractive when its mechanical condition, controller generation, software options, maintenance requirements and available support are suitable.
A new robot may offer advantages in supported features, manufacturer warranty, current software ecosystems, efficiency or lifecycle support, depending on the model and the project.
Neither option should be selected from purchase price alone.
Compare the complete delivered system and the responsibilities included in the offer: inspection, tooling, software, commissioning, safety validation, operator training, spare parts and future maintenance.
A lower initial price is only a saving if the resulting system can meet production requirements reliably.
How much automation value is needed to justify the investment?
A basic financial calculation can turn a vague automation proposal into a useful first discussion.
Suppose, purely as an illustrative example, that a complete robotic project costs €100,000 and is expected to deliver €40,000 in defensible annual net operating benefits.
Its simple payback would be:
€100,000 ÷ €40,000 per year = 2.5 years.
That calculation is not a prediction for any real robotic cell. It assumes the annual benefit is actually achieved and properly accounts for recurring costs. It also does not incorporate discounted cash flows, financing, taxes or residual value.
More importantly, the result is only as credible as the assumptions behind it.
If the savings depend on additional production, ask whether customers actually need that output. If they depend on reduced operator hours, verify how those hours will be reassigned or removed from the process. If they assume improved quality, quantify current scrap and the reduction that can reasonably be demonstrated.
AYXWORKS provides a free Automation Business Case Planner to help structure these assumptions, calculate simple payback and evaluate different project budgets.
The tool is intended for preliminary planning, not as a replacement for a quotation or detailed feasibility study.
What IFR expects in 2026 and beyond
IFR’s September 2026 outlook projects further growth in industrial robot installations.
- 2026 forecast: approximately 655,000 installations worldwide, a projected increase of 9%.
- 2029 forecast: approximately 806,000 annual installations.
The regional outlook is less uniform. IFR’s public conference presentation anticipates installation growth of approximately 11% in Asia, no overall growth in Europe and 2% in the Americas for 2026.
These figures are forecasts, not measured outcomes. The actual results may differ as manufacturers respond to investment conditions, industrial policy, trade restrictions, supply-chain changes and technological developments.
IFR also identifies developments in artificial intelligence, machine vision, sensing and easier robot integration as potential drivers of adoption.
These trends are worth following, but they should not be confused with proof that a particular AI-enabled or vision-guided system will work reliably in a specific production environment.
An impressive demonstration still needs to become a repeatable process with acceptable error rates, predictable recovery and supportable operating costs.
Five questions to ask before approving a robotics project
If World Robotics 2026 has encouraged your company to reconsider an automation project, start with these questions:
- What exact production problem are we solving? Capacity, quality, ergonomics, labor availability or another clearly defined constraint?
- Do we have reliable baseline data? Can we measure the current process rather than relying on nominal machine specifications?
- What happens when something goes wrong? Who handles rejected parts, machine alarms, loss of communication, restart conditions and maintenance?
- Have we priced the whole system? Robot, tooling, guarding, engineering, programming, installation, validation and ongoing costs?
- What result would prove success? A defined cycle time, acceptable quality, required availability and an economically justified improvement?
If those questions cannot yet be answered, the next useful investment may be a feasibility assessment rather than the robot itself.
What this analysis does not establish
This article uses IFR’s public 2026 press release and conference presentation. AYXWORKS has not audited IFR’s underlying datasets or independently reviewed the complete paid World Robotics 2026 report.
Country totals, market shares and forecasts remain attributed to IFR. The practical engineering examples are explanatory scenarios, not measured results from customer installations.
Global market statistics cannot establish application-specific payback, robot reliability, integrator capacity, equipment suitability or compliance with machinery safety requirements.
For any actual installation, the necessary engineering evaluations, applicable safety requirements, risk assessment, validation and commissioning responsibilities must be established by qualified parties.
Sources and further reading
- International Federation of Robotics — Five Million Robots now Operate in Factories Globally. Official press release, 24 September 2026. Source for operational stock, annual installation growth, country statistics and outlook.
- IFR — World Robotics 2026 Market Presentation. Official public conference presentation, 24 September 2026. Source for detailed stock, installation, customer industry, cobot and regional forecast figures.
The bigger lesson: automate the process, not the headline
Five million industrial robots in service worldwide is a remarkable engineering milestone. It reflects decades of improvements in robotics, control systems, mechanical design, programming, sensing and industrial integration.
But the next successful automation project will not necessarily belong to the factory that buys the newest robot or follows the fastest-growing market.
It will belong to the manufacturer that understands its process, selects suitable technology, handles integration and safety properly, and verifies the result.
The global statistics tell us that industrial robotics is established. Your production data must tell you whether it makes sense for your business.
If you are exploring an application, start with the AYXWORKS Robotics & Automation guide, which connects practical production requirements with possible approaches to automation.
Technical evaluation, equipment supply and feasibility work can be explored with Eurobots and ReBots, with integration and commissioning responsibilities defined for each project rather than assumed.
You can also read more about the engineering background and approach on the AYXWORKS portfolio.
One final question: if you could automate just one task in your factory tomorrow, which task would deliver the greatest measurable improvement—and what evidence would convince you?
Featured photograph credit: Mixabest, KUKA Industrial Robots IR, Wikimedia Commons, licensed under CC BY-SA 3.0. Original image depicts historical KUKA industrial robots from 1983; the supplied cover is described as cropped to 16:9. This archival photograph does not depict the 2025 robot installations measured by IFR.