On this page
Many Excel users chase newer formulas, overlooking built‑in features that can streamline work instantly. This article highlights seven Excel tools that require no extra learning and can save hours each week. By mastering these ribbon‑based utilities, you can navigate large sheets, audit formulas, collaborate without conflict, and let Excel do the heavy lifting.
Most spreadsheet users spend hours hunting for new formulas when the real bottleneck is navigating unwieldy tables and tracking scattered dependencies. By adopting the built‑in features highlighted here — like the Data Form for wide datasets and the Watch Window for cross‑sheet calculations — analysts, finance teams, and anyone who lives in Excel can cut scrolling, reduce errors, and reclaim time for higher‑value work. The payoff is immediate: faster audits, cleaner reports, and less frustration during tight deadlines.
Why This Matters
Understanding Excel’s hidden tools shifts the focus from memorizing syntax to leveraging existing functionality. Features such as Data Form and Watch Window reduce scrolling and context‑switching, while Evaluate Formula demystifies nested calculations. These tools are already present in most installations, meaning you can start using them today without installing add‑ins or purchasing upgrades. The result is a smoother workflow and fewer errors.
Data Form
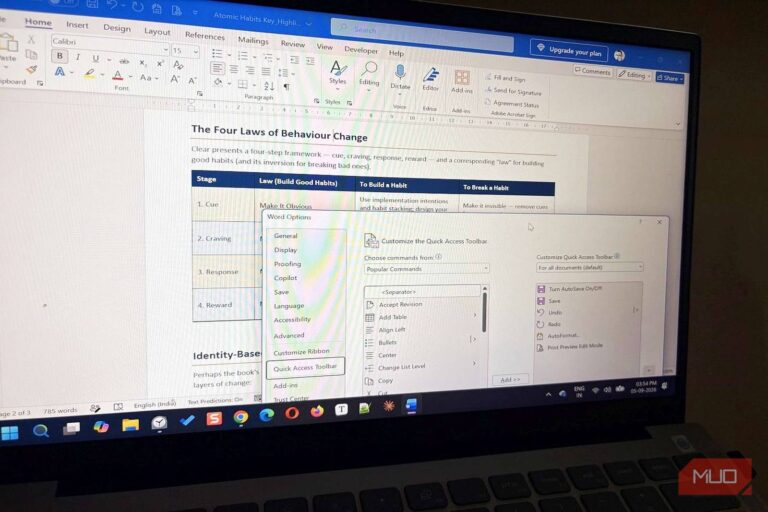
When a worksheet contains many columns, scrolling left and right becomes tedious. Data Form transforms a wide table into a compact pop‑up that displays each record as a form, letting you view, edit, add, search, or delete rows without moving across the sheet. To enable it, go to File → Options → Quick Access Toolbar, choose All Commands, select Form, and click Add. Once the icon appears on your QAT, select the data range and launch the form. Remember that Data Form works with up to 32 columns, cannot print, and does not edit formulas directly. Source
Tip: Use the Criteria button inside Data Form to filter records with wildcards, then click Restore to revert changes before confirming.
Watch Window
If you depend on cells scattered across multiple sheets, constantly jumping between tabs wastes time. The Watch Window pins selected cells, showing their current values, formulas, and locations in a floating toolbar that you can dock anywhere. Activate it via Formulas → Formula Auditing → Watch Window → Add Watch. You can double‑click an entry to jump directly to the referenced cell, even in another workbook. Note that only one watch per cell is allowed and external links update only while the file remains open. Source
Note: Dock the Watch Window to the side of your screen to keep it visible while you work on other sheets.
Evaluate Formula
Complex nested formulas can be intimidating, but Evaluate Formula walks you through each calculation step by step. The tool underlines the part being solved and displays intermediate results in italics, letting you verify logic without guesswork. Access it by selecting a cell, then choosing Formulas → Formula Auditing → Evaluate Formula. You can “step into” nested formulas for a deeper look. The feature works on one cell at a time, which is usually sufficient for troubleshooting lengthy expressions. Source
Key points: Evaluate Formula shows each step, allows stepping into nested parts, and works on a single cell.
Sheet Views
Collaborative workbooks often suffer when one user’s filter changes the view for everyone. Sheet Views let you create a personal filter or sort that does not affect teammates. Each worksheet can store up to 256 views, identified by an eye icon on the tab. To create a view, go to View → Sheet View → New, apply your filter or sort, and keep it for later use. The feature requires the file to be saved on OneDrive or SharePoint; locally stored workbooks cannot use Sheet Views. Source
Speak Cells
Verifying numbers against a printed report can strain the eyes. Speak Cells reads cell contents aloud, letting you confirm values by listening. Enable it through File → Options → Quick Access Toolbar, add Speak Cells, Stop Speaking, and On Enter commands. Once added, clicking Speak Cells on Enter will read each cell as you press Enter, or you can select a range and click Speak Cells to hear it immediately. If no range is chosen, Excel expands to neighboring valued cells. Source
Goal Seek and Power Query
When you know the desired result but not the input needed, Goal Seek does the reverse engineering. For example, to find the loan principal that yields a $400 monthly payment, set the formula cell in Set cell, enter 400 in To value, and choose the adjustment cell in By changing cell. Goal Seek varies one input to reach the target. Access it via Data → What‑If Analysis → Goal Seek. Remember it adjusts only a single variable; for multiple variables you need the Solver add‑in. Source
Power Query’s From Folder connector merges many files—CSVs, Excel workbooks, JSONs—into one table, provided they share a consistent schema. Use Data → Get Data → From Folder → Combine. Power Query creates helper queries: an Example/Sample File, a Transform Sample File, a Transform File (Function), and the Final/Output Query. Edit the Transform Sample File to apply cleaning steps to all source files before they are combined. Source
What to Do Next
Start by adding the Data Form and Watch Window icons to your Quick Access Toolbar; they take less than a minute. Next, try Evaluate Formula on a complex nested formula to see each step. Experiment with Sheet Views on a shared workbook to keep your personal filter private. Finally, enable Speak Cells for auditory verification and explore Goal Seek or Power Query when you need reverse lookups or batch file consolidation.
Want more practical guides? Explore more Ayxworks insights and save this article for later.
FAQ
What is the main advantage of using Excel’s built‑in tools instead of learning new formulas?
The main advantage is immediate time savings without extra study. Tools like Data Form and Watch Window are already in the ribbon, so you can start streamlining tasks right away.
How do I enable the Data Form if it doesn’t appear on my ribbon?
Go to File → Options → Quick Access Toolbar, choose All Commands, select Form, click Add, then OK. The icon will appear on your QAT for quick access.
Can I use Watch Window to monitor cells in a different workbook?
Yes. You can add a watch to any cell, even in another open workbook, and double‑click the entry to jump directly to that cell.
Does Sheet Views work with workbooks saved only on my computer?
No. Sheet Views require the file to be stored on OneDrive or SharePoint; locally saved workbooks do not support this feature.
Is Goal Seek able to adjust more than one input cell at a time?
No. Goal Seek changes only one input cell to reach a target value. For multiple variables, use the Solver add‑in.
What file types can Power Query’s From Folder connector combine?
It can combine CSVs, Excel workbooks, JSONs, and other structured files, as long as they share a consistent schema (matching column names and data types).
External Sources and Further Reading
Choose an Excel tool by the problem you actually have
Rather than memorizing another feature list, begin with the shape of your spreadsheet problem:
- Repeated cleanup: use Power Query when incoming CSV or spreadsheet files need the same transformations every week.
- Large lists that need summarizing: use a PivotTable to group totals by customer, date, region, or status without copying dozens of formulas.
- Unexpected duplicates: use Remove Duplicates on a copied sheet first, and decide which columns define a duplicate before deleting records.
- Incorrect user input: use Data Validation to constrain options, and Conditional Formatting to make exceptions visible.
Ten-minute example: import a monthly sales CSV, standardize dates in Power Query, load the cleaned data as a table, and build a PivotTable showing totals by month. Refresh the query with the next file, then review anomalies instead of rebuilding the report.
Some commands and availability vary across Excel for Windows, Mac, and the web. Verify the workflow on your platform and keep an unchanged source copy before using destructive cleanup operations.
See Microsoft’s Excel Blog for current feature changes.